Customer Feedback Analysis: A 2026 Framework for Growth
A practical framework for customer feedback analysis: sorting themes, prioritizing by impact, and turning insights into action.
In this article
- When Feedback Stops Helping You Decide
- What Customer Feedback Analysis Means
- Qualitative and Quantitative Signals Working Together
- The Four-Stage Framework That Turns Feedback Into Decisions
- Metrics and Signals That Drive Decisions
- Pitfalls That Break Most Feedback Programs
- Two Short Stories of the Framework in Practice
- How ZenX Testimonials Fits Each Stage
You've got the feedback, but the decision still feels slow. Reviews live in one tab, support tickets in another, survey scores in a dashboard, and social comments keep pointing in different directions. The team isn't short on customer input, it's short on a system that turns that input into a next move.
When Feedback Stops Helping You Decide
That's the point where customer feedback analysis starts doing real work. A launch can be held up for weeks because reviews sit in one inbox, support tickets sit in another, and interview notes live in a document no one checks during planning. The team keeps seeing complaints about setup friction, but without centralization, tagging, and a repeatable way to compare themes, no one can tell whether the issue is a bug, a wording problem, or a pricing objection. Modern guidance keeps pushing teams to aggregate feedback into one system before they try to act on it, then connect it to measurable priorities like frequency, severity, and strategic relevance.
What you get from a real analysis workflow
A working feedback program gives you a way to move from raw comments to decisions you can defend this quarter. It shows what customers are saying across surveys, ratings, interviews, reviews, social posts, and support interactions, then helps you classify those signals instead of treating them like a pile of anecdotes (Zendesk, CustomerScience).
Practical rule: if the team can't answer “what changed, how often, and how serious is it,” the feedback has not been analyzed yet.
That is what separates a feedback program that supports planning from one that only records noise. It gives analysts and product teams a way to decide whether a pattern deserves a fix, a follow-up study, or no action at all. It also makes the trade-off visible, because every issue you promote into the roadmap pushes something else down.
A usable workflow also changes the tool choice at each stage. Collection needs broad intake from channels people already use. Processing needs consistent tagging and deduplication. Analysis needs a way to compare themes over time. Action needs a place where owners can see what was decided and why. Skip one stage and the next one gets weaker, which is why teams often end up with plenty of input and very little decision support.
What Customer Feedback Analysis Means
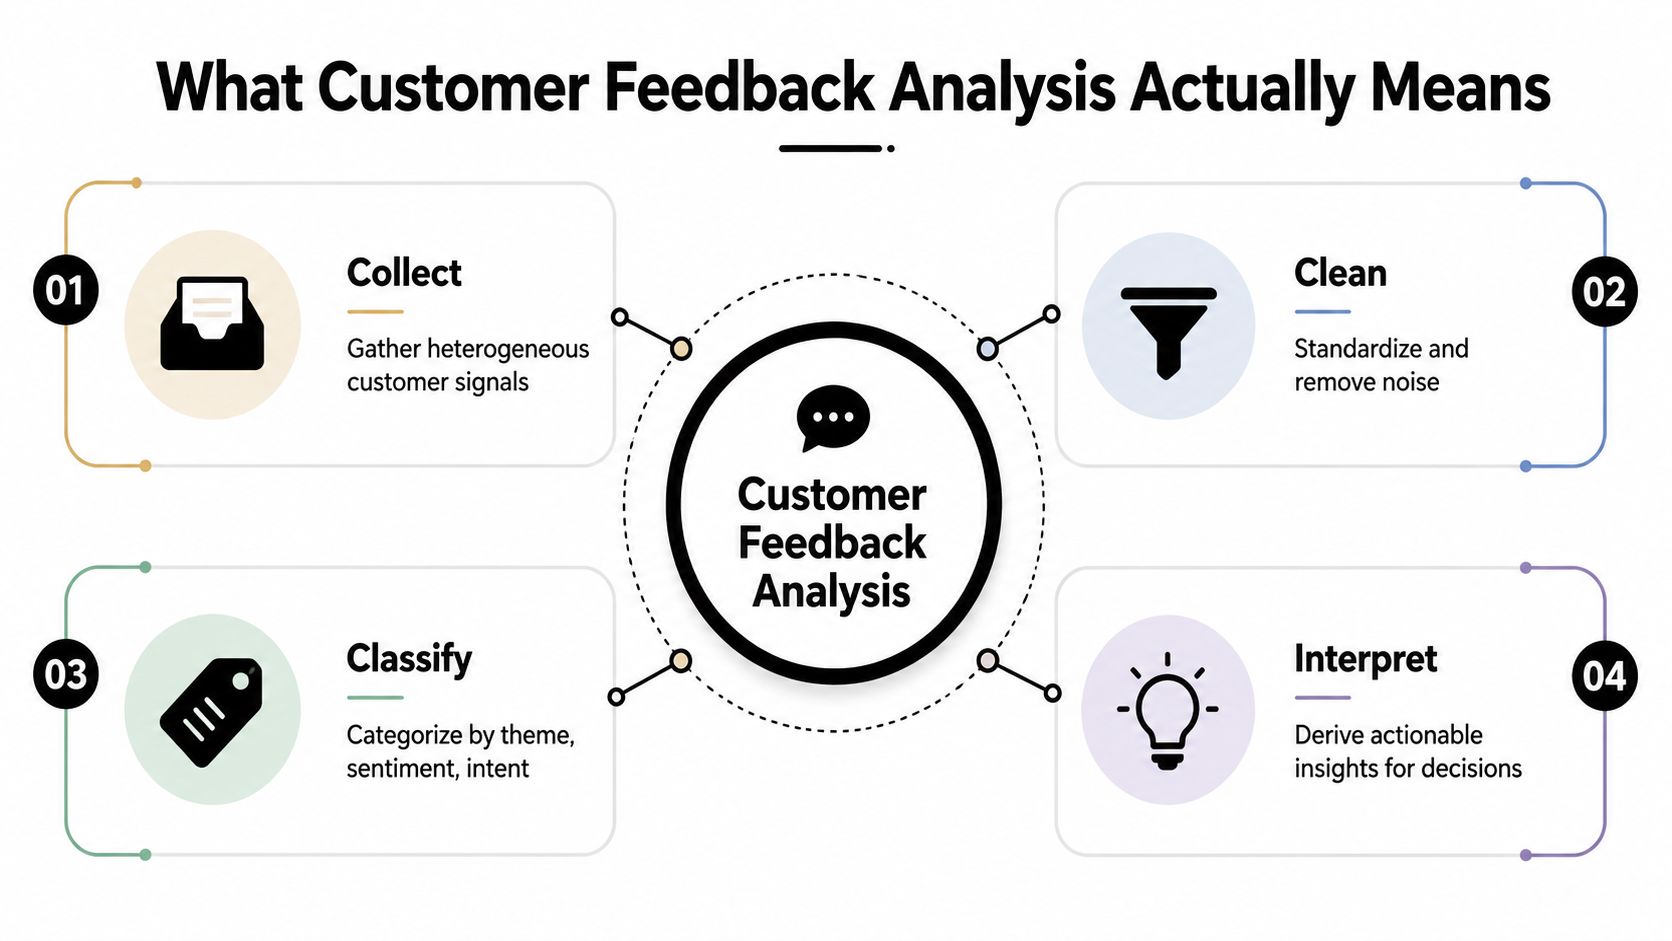
Customer feedback analysis is the structured process of collecting, cleaning, classifying, and interpreting customer signals so they become actionable insight instead of stray opinions. In practice, that means a team pulls feedback into one place, removes duplicates and obvious noise, tags each item by theme or issue, then reads the patterns with enough context to decide what deserves action. If the data is scattered or unlabeled, analysts are forced to guess at meaning instead of reviewing a clean set of evidence.
Centralization is the part teams skip
The foundation is centralization. Feedback comes in from surveys, ratings, interviews, reviews, social media, support tickets, and call transcripts, and those sources need to land in one dataset before anyone starts judging patterns or priorities.
That matters because the next steps depend on the shape of the intake. If support tickets stay in one tool, survey comments in another, and sales notes in a third, the team ends up arguing about which channel is “right” instead of seeing the full pattern. A practical workflow usually starts by routing comments into a shared repository, then tagging support tickets by theme before sentiment scoring, so the team can compare recurring issues with emotional tone rather than treating every comment as a one-off complaint. Teams that skip this step usually get stuck with scattered evidence and no reliable way to compare it.
What the discipline produces
The useful output isn't “customers are unhappy.” It is a set of measures the team can act on, such as frequency, severity, and strategic relevance, tied to product, support, or marketing priorities. That is why mature teams move from raw comments to categorized themes, then to ranked actions. The point is to make the next decision clear enough that a weekly leadership meeting can use it without re-litigating the input.
A useful feedback system also needs a place where decisions are recorded, owners are named, and follow-up is visible. That turns analysis into an operating system instead of a one-off report. If you need a practical starting point for intake, the feedback collection process has to be set up before the analysis layer can do real work.
In practice, strong programs combine qualitative review with standard CX metrics. The comments explain the numbers, and the numbers show where to look first. Without that pairing, feedback stays persuasive in the room but weak in the workflow.
Qualitative and Quantitative Signals Working Together
A score can rise while customers are still stuck. That happens when the number looks healthy but the comments point to friction in the journey, usually in onboarding, handoff, or first use.
The two signal types do different jobs
Quantitative inputs give you structure. NPS, CSAT, CES, star ratings, and frequency counts show where friction is appearing and whether it is broad enough to act on now. Qualitative inputs, like open-text comments, interviews, call transcripts, social posts, and reviews, explain the language customers use and the specific moments that triggered the response.
The mistake is treating one as a replacement for the other. A high CSAT on a feature means very little if the comments show that the path to that feature is still confusing. A low-volume but severe complaint from an important segment can outweigh a lot of casual praise, because the operational damage is concentrated where it hurts most.
| Input type | Example sources | What it tells you | Where it fits | Concrete scenario |
|---|---|---|---|---|
| Quantitative | NPS, CSAT, CES, star ratings, frequency counts | Direction, scale, and trend | Spotting where to look | Onboarding scores stay high after a launch, so the team assumes the flow is working. |
| Qualitative | Open-text surveys, interviews, call transcripts, social posts, reviews | Context, language, cause, emotion | Understanding what to change | The comments keep mentioning setup confusion, missing guidance, and a slow first login, which shows the issue is not satisfaction with the product, it is friction before users reach value. |
Numbers help you choose the lane. Comments tell you how to steer once you are there.
For teams setting up intake, a practical starting point is the feedback capture process in how to get customer feedback. Use that as the front door, then make sure the back end can classify what comes in.
The rule is straightforward. Use quantitative inputs to locate the issue, then use qualitative inputs to decide what the fix should be. When both work together, frequency and severity scoring become useful because they are tied to the actual words customers use, not just a number sitting in isolation.
The Four-Stage Framework That Turns Feedback Into Decisions
Treat feedback like an operating system, not a project. The point is not to store opinions in one place, it is to move each signal through a repeatable chain that ends in a decision a team can ship. Each stage needs its own tool choice. If collection is sloppy, processing turns into cleanup work. If processing is thin, analysis produces noise. If analysis does not lead to action, the program becomes an archive with a nice dashboard.
Collect and process before you judge
Collect means gathering heterogeneous inputs into one dataset, because repeated patterns stay hidden when reviews, tickets, testimonials, survey responses, and social posts sit in separate places. Intake tools matter here, not reporting tools. Survey platforms and feedback forms are the first choice for structured capture, while review feeds, support inboxes, and interview notes need to land in the same pipeline without manual copy and paste.
Process is the cleanup and tagging layer. Remove duplicates, standardize fields, and apply a consistent taxonomy for themes, products, segments, and sentiment. That stage usually needs a tagging system or text management layer that can keep labels consistent across channels, because frequency and trend analysis only hold up when the underlying structure does. A broken label set makes every weekly report suspect.
Analyze and act with clear priorities
Analyze is where AI categorization, sentiment analysis, keyword extraction, and machine learning help teams group themes at scale. The useful setup is a small manually tagged sample to train or check the model, then a review layer that can sort what matters by frequency, severity, revenue impact, and strategic alignment instead of by whichever complaint is loudest in the room. A tool like AI Review Insights fits here because the job is to surface patterns, not just count mentions.
Act is the step many teams postpone. The work here is to choose the highest-value theme, assign ownership in a project management tool, ship the change, and close the loop with the customers whose feedback shaped the decision. Without that handoff, analysis stays interesting but does not change the product or the service. Closing the loop also keeps participation alive, because people notice when their input turns into something visible.
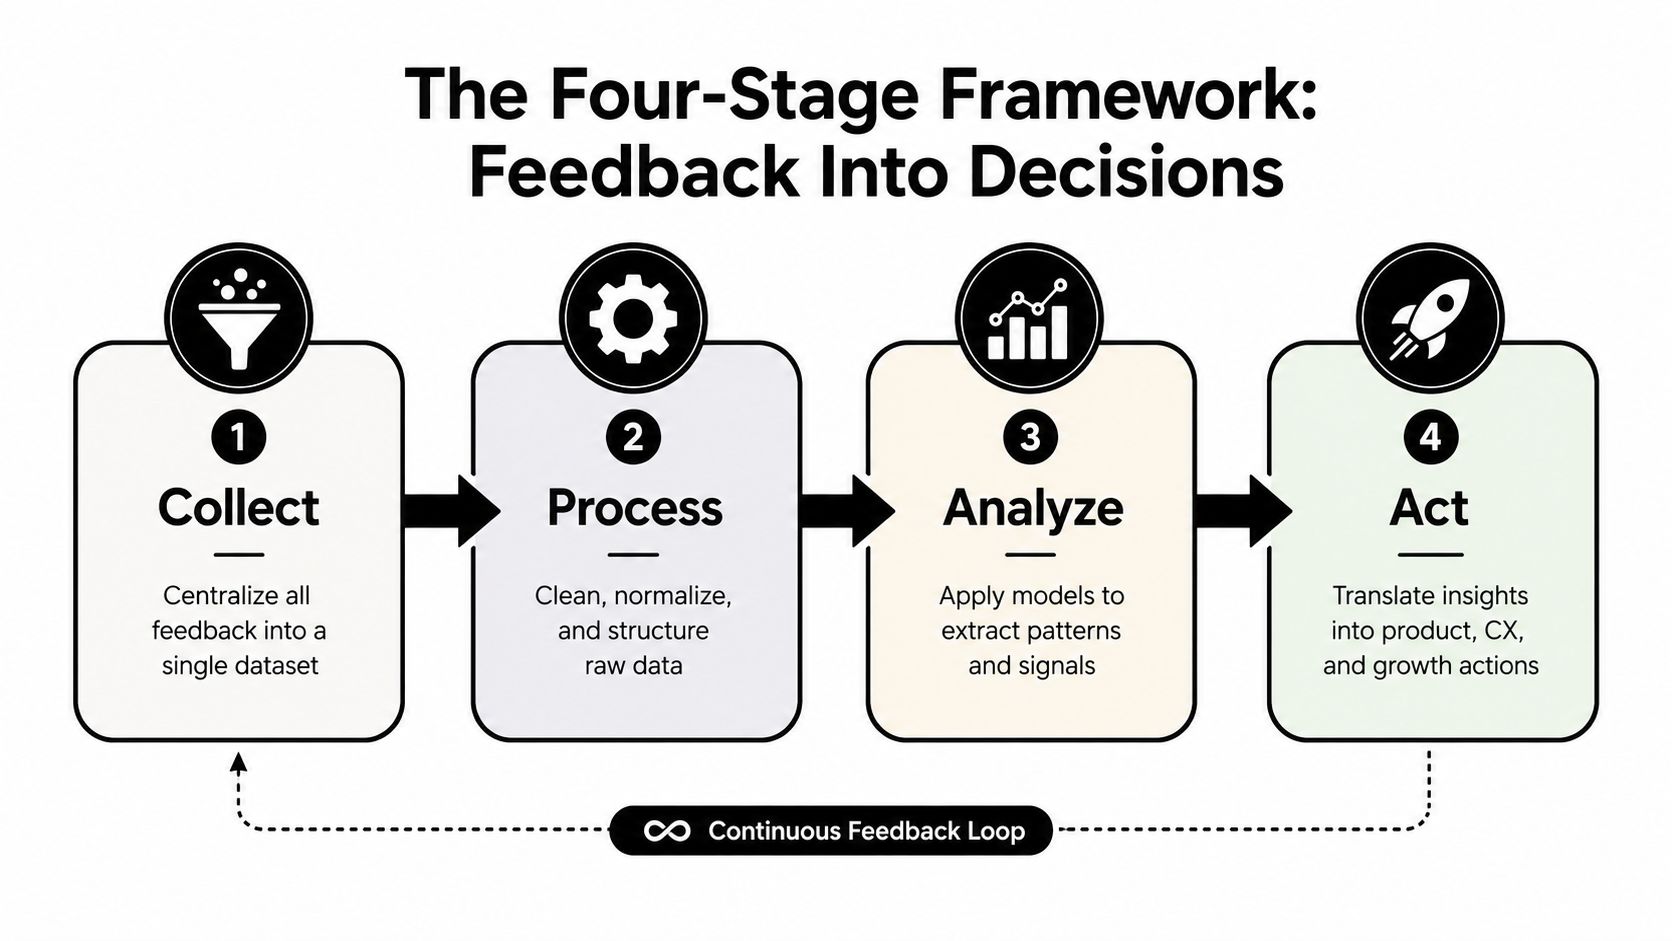
Skip one stage and the chain weakens. Collecting without processing creates a pile of unstructured input. Processing without analysis creates tidy records that still do not point to a decision. Analysis without action creates a backlog. Action without closing the loop tells customers their effort did not matter, and the next wave of feedback usually reflects that.
Metrics and Signals That Drive Decisions
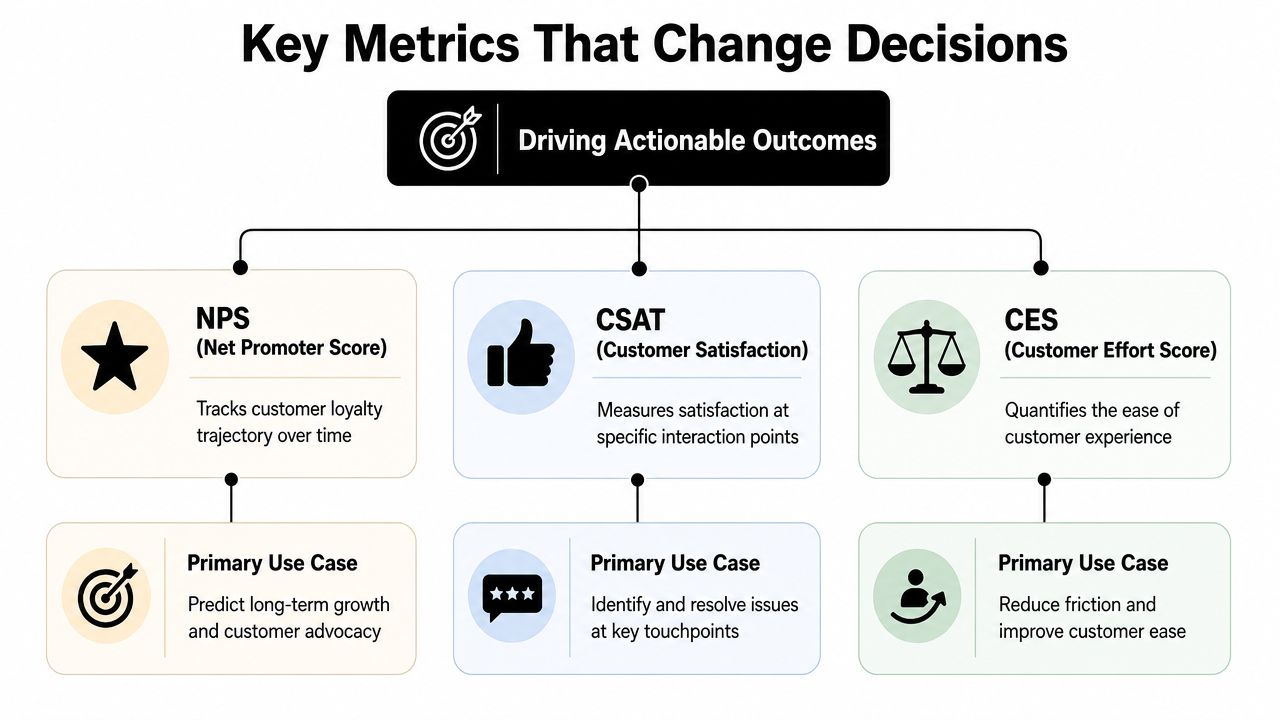
Most feedback dashboards have too many numbers and too little judgment. The useful set is small. NPS helps track loyalty over time, CSAT shows satisfaction at a specific interaction point, CES captures effort, and theme-level frequency and severity show where the team should invest next.
How to read conflicting signals
A strong CSAT score on a feature does not erase the complaints in the comments. It usually means the feature itself is acceptable while the surrounding journey is still broken. In practice, that means analysis has to tie the score to the language customers use, especially when they point to onboarding, billing, setup, or support handoffs.
The clearest decisions come from comparing signals, not treating them as rivals. I have seen teams with healthy NPS and weak CSAT on a specific flow choose to keep the overall product direction intact while fixing that flow first, because the loyalty trend was fine but the experience at a key step was causing friction. In another case, the reverse pattern showed up, NPS was falling while CSAT stayed steady on individual tickets, which told the team the problem was cumulative, not tied to one support touchpoint. They changed the product messaging and onboarding sequence, not the support script, because the issue lived before the first success moment.
Frequency matters, but it does not decide alone. A low-frequency issue can still outrank a dozen routine comments if the severity is high or the affected accounts carry more business weight. Several industry guides recommend prioritizing by customer impact, frequency of occurrence, and business impact, with strategic alignment as the tie-breaker.
Practical rule: if a theme is common, painful, and tied to business risk, it moves first.
For teams building insight delivery, AI Review Insights is useful because it groups feedback by theme and quote instead of leaving the team with a pile of raw text. That matters because analysis has to end in a decision, not a reading session.
The other habit that pays off is tracking these signals over time. A point-in-time snapshot can help, but the value grows quarter after quarter as recurring themes get cleaner, the taxonomy gets more stable, and the team can see whether the fix held.
Pitfalls That Break Most Feedback Programs
Most broken feedback programs do not fail loudly. They drift. The dashboard keeps filling up, meetings keep happening, and the same issues stay unresolved because the system keeps overcounting the wrong things and undercounting the right ones. That is usually a process problem, not a volume problem.
Four mistakes that show up fast
Anecdotal loudness happens when one dramatic complaint starts steering the roadmap while broader but quieter problems are ignored. A single viral support email can derail a Q3 planning meeting for two days, even when review themes point somewhere else. The correction is to weight themes by frequency and severity, then check whether the issue is widespread before you spend engineering time on it.
Duplicate counting shows up when the same complaint enters through email, support, and reviews, then gets counted three times. A common version is a billing complaint that appears in the help desk, then again in a social post, then once more in a post-call survey, which makes the team think it is three separate problems. The fix is straightforward, deduplicate at intake before the theme starts to look larger than it is.
Taxonomy drift is what happens when different teams use the same label differently. Product says “onboarding,” support says “setup,” and marketing maps both to “activation,” so the reporting looks aligned while the work stays fragmented. A release can go out with one team tagging comments as feature requests and another tagging the same notes as bugs, which makes weekly reviews useless. Lock the taxonomy in a shared document and make the labels consistent across the org.
Closed-loop neglect is the one that hurts response rates later. If customers never hear back after they submit feedback, they stop believing the effort matters. I have seen this turn into a simple pattern, the product team keeps collecting comments, but the same customers stop answering follow-up surveys because nothing ever comes back to them. Assign an owner for follow-up and make response part of the process, not a courtesy when someone has spare time.
The best programs do not try to eliminate subjectivity. They reduce avoidable distortion.
The trade-off is speed versus rigor. Teams want fast answers, but fast answers built on bad labels and duplicate items are just expensive guesses. The stronger move is to slow intake a little, clean the feed, and speed the decision that comes after it. If you need a quick way to sanity-check whether the effort is worth it, a practical ROI calculator helps make the cost of ignoring repeated signals visible enough that leaders stop treating them as anecdotal noise.
Two Short Stories of the Framework in Practice
A B2B SaaS team can feel busy and still be blind. One team I've seen had support tickets in one system, reviews in another, and product comments buried in email. Once they unified intake into a single library and clustered themes, the loud pricing complaints turned out to be a distraction. The actual churn driver was onboarding friction, so they shipped a guided setup flow instead of spending another sprint on packaging debates.
A local services example that changed the schedule
A dental clinic had a different problem. Google reviews and submitted feedback kept mentioning missed reminders and confusing timing, so the front desk consolidated the comments and looked for the recurring theme instead of treating each note as a one-off. The fix was a redesigned SMS reminder cadence, which gave patients a clearer sequence and reduced the number of appointments that were lost to simple confusion.
If you want a quick way to sanity-check whether the effort is worth it, the ROI calculator is a practical place to start. The point isn't to pretend every program has the same economics. It's to make the cost of ignoring a repeated signal visible enough that leaders stop treating it as anecdotal noise.
Both stories have the same shape. Centralize, classify, prioritize, act. The visible business outcome didn't come from collecting more feedback, it came from making one recurring signal obvious enough to change a decision.
How ZenX Testimonials Fits Each Stage
ZenX Testimonials fits cleanly into the operating model because it handles both collection and publication without forcing the team to stitch together separate tools for every step. The browser-based video recorder and frictionless capture flows support collect, especially when you want customers to submit without downloads, logins, or a long setup process. That matters because low-friction capture usually gets more usable responses than a form that asks people to jump through hoops.
Where the product maps to the workflow
In process, the central dashboard, smart tags, and bulk moderation help teams approve, reject, archive, and organize incoming testimonials and imported reviews. That makes the taxonomy work visible and maintainable, which is where a lot of programs slow down.
In analyze, AI Review Insights and Competitor Analysis help extract themes, sentiment, and gaps from collected feedback and public competitor reviews. The practical win here is less manual curation and faster retrieval of the quote or theme you need for a decision.
In act, the Wall of Love widget, Case Study Generator, and Google Review Alerts turn feedback into something visible on the pages that matter and into responses that happen on time. That's where feedback stops being an internal archive and starts affecting trust on-site.
A few choices matter this week. Audit the intake channels you already have. Define a simple taxonomy that product, CX, and marketing can all use. Enable AI insights on the highest-volume feedback source. Then ship a Wall of Love to one landing page that already converts, so the signal is visible where the business feels it.
A CTA for ZenX Testimonials.
Written by
Sunil
ZenX Testimonials
Sunil writes about reviews, testimonials, and the everyday work of earning customer trust.